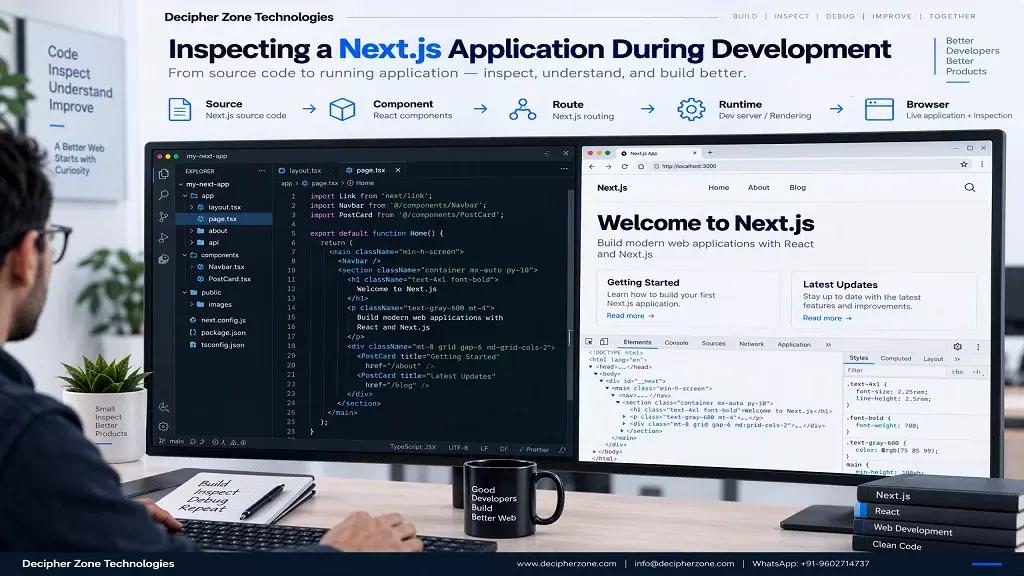
Open the Network tab in Chrome while a Next.js page loads and you will see only half the story. Calls made from the browser show up there. The fetch requests your server components fire during rendering do not. They run inside Node.js, so they surface, if at all, as scattered lines in a terminal window.
That gap is where a lot of debugging time disappears. A slow dashboard, a stale list, a 500 from a route handler: each one forces you to hop between the browser console, the Network tab and the terminal, then piece the timeline together by hand. @djarin/next-inspect was built to close that gap with a single in-app panel.
Quick Answer: Next.js Request Logger
Next.js Request Logger is an MIT-licensed development tool for the Next.js App Router. After a one-time setup, it records API calls, server-side fetch requests and console output, then streams them to a floating dashboard inside your running app. Every entry carries the method, URL, status, duration, request and response bodies, and the exact file and line that triggered the call. In production builds it turns itself off.
It supports Next.js 14, 15 and 16 with React 18 or 19, and the current release at the time of writing is version 0.1.4.
Why Request Debugging in the App Router Gets Messy
The App Router lets components fetch data on the server, which is great for performance and a little awkward for visibility. A single page render can trigger several outbound requests to a CMS, a payment service and your own API, none of which the browser ever sees directly.
Caching adds another question. When a fetch uses force-cache or revalidate, Next.js may serve the answer from its Data Cache and never touch the upstream service. Without some form of logging, you cannot tell whether a slow response came from the network or whether a fast one was simply cached.
Most developers fall back on scattered console.log lines and remove them before the pull request. It works, but it is slow, easy to forget and impossible to share with a teammate who joins the session late. If you are weighing how requests flow through a larger system, our guide to web application architecture covers the wider picture.

What the Package Captures
The pitch is zero-code logging. You do not wrap individual calls or add helper functions. Once the plugin is active, the following sources are recorded automatically.
| Source | What you see in the panel |
|---|---|
| API calls | Any request under /api/ (the prefix is configurable), including bodies, status, duration and initiator |
| Server-side fetches | Outbound fetch calls from your server code, with Data Cache hits tagged as [server cache] and shown at 0ms |
| Page requests | Full page navigations such as /sites, once you switch on logPages |
| Errors | 4xx and 5xx API responses, rewritten as structured JSON instead of an HTML error page |
| Browser activity | Client fetches and console output, with the calling file and line passed along through an X-Initiator header |
Requests to the inspector's own /__log-inspector/* routes are never logged, so the panel does not clutter itself.
The file-and-line initiator is the detail most teams end up valuing. Instead of asking which component made that slow call, you read the answer straight off the log entry.
How to Set It Up in Four Steps
Step 1: Install the package
Add it as a dev dependency so it stays out of your production dependency tree.
npm i -D @djarin/next-inspect
Step 2: Wrap your Next.js config
Import withLogInspector from the plugin entry point and wrap your config object in next.config.mjs or next.config.ts.
import { withLogInspector } from '@djarin/next-inspect/plugin';

export default withLogInspector()({
  // Add package to transpilePackages when linking source or in monorepos
  transpilePackages: ['@djarin/next-inspect'],
  // Next.js basePath (if your app uses a custom base path like '/traccrops')
  basePath: process.env.NEXT_PUBLIC_BASE_PATH || '',

  // REQUIRED FOR NEXT.JS 14:
  // Next.js 14 requires this flag to enable instrumentation.ts.
  // Next.js 15 users can omit this as it is stable and enabled by default.
  experimental: {
    instrumentationHook: true,
  }
});
Two notes on that snippet. The experimental.instrumentationHook flag is required on Next.js 14 so that instrumentation.ts runs. Next.js 15 users can drop it, since instrumentation is stable there. The transpilePackages line matters when you link the package from source or work inside a monorepo.
Step 3: Create the UI wrapper
The panel is a client component, so load it dynamically with server rendering switched off. A small file such as src/components/log-inspector.tsx does the job.
"use client";

import dynamic from 'next/dynamic';

const LogInspector = dynamic(
  () => import('@djarin/next-inspect/components').then((mod) => mod.LogInspector),
  { ssr: false }
);

export function LogInspectorWrapper() {
  return (
    <LogInspector
      // Optional: set to true to explicitly log browser fetches to external domains (e.g. CDNs, 3rd party APIs).
      // By default, the client fetch interceptor only logs same-origin (/api/*) requests.
      options={{ logExternal: false }}
    />
  );
}
By default the browser-side interceptor logs only same-origin /api/* calls. Set logExternal to true if you also want to see requests that go to CDNs or third-party APIs.

Step 4: Render it in the root layout
Import the theme stylesheet and place the wrapper once inside app/layout.tsx.
import '@djarin/next-inspect/inspector-theme.css';
import { LogInspectorWrapper } from '@/components/log-inspector';

export default function RootLayout({ children }) {
  return (
    <html lang="en">
      <body>
        {children}
        <LogInspectorWrapper />
      </body>
    </html>
  );
}
Start your dev server and the floating panel appears. If you would like to try it before touching your own project, the maintainers also offer a ready-made StackBlitz playground, and the source lives in the GitHub repository.
Files the Plugin Generates
The plugin writes a few files into your app/ directory (or src/app/ when that folder exists). It is worth knowing what they are, because they will show up in your git status after the first run.
| File | Purpose |
|---|---|
app/__log-inspector/stream/route.ts | The server-sent events endpoint the panel listens to |
app/__log-inspector/clear/route.ts | A POST endpoint that empties the buffered logs |
instrumentation.ts | Created only when missing, and wires up the fetch interceptor and incoming request capture |
Manual composition
If your app already has custom server setup, you can wire capture manually in instrumentation.ts:
import { installServerCapture } from '@djarin/next-inspect/server';

export async function register() {
  installServerCapture({
    apiPrefix: '/api/',       // only log /api/* requests
    logPages: true,           // log non-API page requests (e.g. /sites)
    errorToJson: true,        // rewrite 4xx/5xx to JSON
    skipPaths: ['/__log-inspector', '/_next/'], // skip inspector routes + Next internals
  });
}
Plugin options
withLogInspector({
  basePath: '__log-inspector',     // route prefix under app/
  appDir: 'app',                   // app directory (default: 'app', or 'src/app' if src/app exists)
  autoCreateInstrumentation: true, // generate instrumentation.ts
  capture: {
    apiPrefix: '/api/',
    logPages: true,
    errorToJson: true,
    skipPaths: ['/__log-inspector', '/_next/'],
  }
});
apiPrefix decides which incoming routes count as API calls. logPages adds ordinary page navigations to the stream. errorToJson converts failing API responses into readable JSON, which is far kinder to your eyes than a raw HTML error document. skipPaths hides anything whose URL contains one of the listed strings.
If your app already has a custom server setup, skip the plugin's generated file and call installServerCapture from @djarin/next-inspect/server inside your own instrumentation.ts. It accepts the same options.
Cutting Out Noise from Fonts and CDNs
Server-side calls to services such as Google Fonts can fill the panel with entries you do not care about. Add their hostnames to skipPaths and they disappear.
withLogInspector({
  capture: {
    skipPaths: ['/__log-inspector', '/_next/', 'fonts.googleapis.com'],
  },
})
One clarification saves confusion later. The inspector only sees requests made through JavaScript fetch(). Standard HTML tags such as <img>, <script> and <link> are loaded directly by the browser, so they will never appear in the panel.
Production Behavior and basePath Support
You do not need environment flags or conditional imports to keep the tool out of production. The library checks NODE_ENV, which npm run build sets to production automatically, and then disables itself. The plugin becomes a passthrough that creates no routes, the component renders nothing, and the server and client interceptors are never installed. The package's own documentation describes the result as zero inspector overhead in the production bundle.
Projects that run under a custom basePath, such as /traccrops, are handled too. The package resolves the effective path for its stream and clear endpoints on its own, and you can set NEXT_PUBLIC_BASE_PATH in your environment file if you prefer to be explicit.
How It Compares with Other Ways of Inspecting Requests
| Approach | Sees server-side fetches | Shows bodies | Points to file and line | Setup effort |
|---|---|---|---|---|
Manual console.log | Only where you add it | Only what you print | No | Repeated for every call |
| Browser Network tab | No | Yes, for browser requests | Partly | None |
| Next.js built-in fetch logging | Yes, in the terminal | No | No | One config option |
| @djarin/next-inspect | Yes, in an in-app panel | Yes | Yes | Four steps, once |
None of these replaces the others entirely. The Network tab remains the right place to study caching headers and asset loading, and the framework's own logging is handy when a terminal line is all you need. The inspector earns its place when you want request details, bodies and origins gathered in one view.
A Practical Debugging Walkthrough
Picture a dashboard page that feels sluggish in development. With the panel open, reload the page and watch the entries arrive. Entries tagged [server cache] at 0ms are being answered from the Data Cache, so they are not your problem. A single outbound fetch showing several seconds of duration is. Click into it, read the response body to confirm the upstream service is returning what you expect, and use the initiator to jump to the component that issued the call.
That whole loop takes a minute or two, where the same investigation with scattered logging can eat an afternoon.
Need a Next.js product built, audited or scaled? Our engineers work with the App Router every day, from data fetching strategy to deployment. Read about our Next.js development services or speak with the team directly.
Get a Free Consultation Hire ReactJS Developers
Where It Fits and Where It Does Not
The tool is a good match for local development, onboarding a new developer to an unfamiliar codebase, and pairing sessions where two people need to see the same request trail. It also helps when you are choosing between caching strategies and want proof of what actually reaches the network.
It is not an observability platform. Because it disables itself in production builds, it will not tell you what real users experience, so keep a proper tracing or monitoring stack for that job. Teams comparing framework options for a new build may also like our overview of top web frameworks.
Cautions Worth Knowing Before You Adopt It
The package is young. Version 0.1.0 appeared in September 2026 and the current release is 0.1.4, so pin the version in your lockfile and read release notes before upgrading.
Request and response bodies are exactly what the panel displays, which means tokens, emails and other sensitive fields can appear on screen. Avoid sharing your screen with live credentials loaded, and prefer test accounts during demos.
Finally, because the plugin generates route files inside app/, decide as a team whether those files belong in version control or in your ignore list.

Final Thoughts
Server-side data fetching made Next.js applications faster and, at the same time, harder to observe. A request logger that captures API calls, server fetches and console output in one place removes a real daily friction, and @djarin/next-inspect does it without asking you to rewrite a single call. Setup is four short steps, the noise is filterable, and production builds stay clean.
If you want expert hands on a Next.js build, whether that means a new product or a performance review of an existing one, our team is ready to help. You can also browse our guide to API development for the backend side of the same story.
Ready to build with a team that knows Next.js inside out?
Book Your Free Consultation Hire Full-Stack Developers
Frequently Asked Questions
What is @djarin/next-inspect used for?
It is a development-time inspector for Next.js that records API calls, server-side fetch requests and console output, then displays them in a floating panel with method, URL, status, duration, bodies and the originating file and line.
Which Next.js and React versions does it support?
The package lists Next.js 14, 15 and 16 as peer dependencies, along with React 18 and 19. Next.js 14 projects must also enable experimental.instrumentationHook in the config.
Is it safe to leave in a production build?
The library detects NODE_ENV=production and disables itself, so the plugin does nothing, the component renders nothing and no interceptors are installed. It is still best installed as a dev dependency, as the setup guide recommends.
Does it log images, scripts and stylesheets?
No. It captures requests made through JavaScript fetch(). Assets loaded by HTML tags such as <img>, <script> and <link> are handled by the browser directly and never reach the inspector.
How do I hide requests to third-party services?
Add part of the URL, such as fonts.googleapis.com, to the skipPaths array inside the capture options. Any request whose URL contains a listed string is ignored.
Does it work with the Pages Router?
The documentation is written for the Next.js App Router, and the setup relies on app-directory route handlers, so Pages Router projects are not covered by the current guide.
Author: Mahipal Nehra is the Digital Marketing Manager at Decipher Zone Technologies, where he leads SEO and content strategy for the company's websites and publishing platforms.